Adience Benchmark Gender And Age Classification
Gender and age classification for single images
Team Member: LIU BOZHONG, ZHOU JIANAN, ZHU ZHICHENG
Time: November 2020
Github Repository: https://github.com/bozliu/Adience

Abstract
This project focuses on the gender and age classification for a single image. We use prevalent CNN architectures (ResNet/VGG) as our backbone and try to improve the accuracy. The first main area of experimentation is to try various network structures, to investigate the effect of hyper-parameters and to design options on the performance. The next facet of the project attempts to propose some novel ideas and tries to improve the accuracy. We propose a new loss function called Order Loss, working with cross-entropy loss to obtain more discriminative features. We also try various data pre-processing and data augmentation methods, and adopt label smoothing to achieve better model calibration and prevent overconfident predictions. Our experiments demonstrate an improvement on both benchmarks.
1 Introduction
Over the last decade, the availability and quality of datasets of human faces have grown at a nearly exponential rate. It arises a lot of applications and attracts computer scientists to tackle problems in computer vision that were previously intractable. The hot topic includes human face detection, face generation and face attributes detection. In this project, we attempt to classify the age and gender of the faces in an image.
Automatic age and gender classification have an increasing number of applications, particularly since the rise of social platforms and social media. For example, many languages have distinct words to be used when addressing a male versus a female or an elder versus a youth. Therefore, automated translation services can factor in gender and age classification of subjects to improve their performance. Also, Social media like Facebook could use the information about the age and gender of the people to better infer the context of the image. For example, if a picture contains many people studying together, it might be able to caption the image with “study session”. However, if it can also detect that the people are all men in their early 20s, it may predict “College students in a fraternity studying”.
Despite the basic roles these attributes play in our day-to-day lives, age and gender classification is still an inherently challenging problem due to the complexity of human faces and environment factors, e.g., illumination. Before 2015, the approaches to estimating or classifying these attributes from face images have relied on differences in facial feature dimensions [1] or “tailored” face descriptors [2, 3, 4]. Most of them have employed classification schemes designed specifically for age or gender detection task. Few of them were designed to handle the challenges of unconstrained imaging conditions [2]. In 2015, Levi et al. [5] proposed the first method to learn representations through the use of deep-convolutional neural networks, and it obtained a significant increase in performance.
In this project, we attempt to investigate the effects of different architectures and hyper-parameters, such as learning rate, optimizers, and loss functions. We also try different methods to improve the performance. For example, we crop the datasets using face detection technique, and do data augmentation to increase the number of training samples and empower our model a better generalization ability. In the end, we improve our model structure and design a combined loss function. We test our ideas on the Adience benchmark for age and gender classification of unfiltered face images [2]. The gender prediction is a binary classification problem, and the age estimation is a multi-class (eight) classification problem.
2 Benchmark
The experimental results show that their method achieves state-of-the-art results on the Adience benchmark (Figure 1) and can gradually learn deep models that handle multiple tasks without forgetting, while maintaining the compactness of the model, and its performance is more satisfactory than single task training.

3 Methodology
3.1 Theoretical Analysis
The task can be seen as a problem of identifying N independent classifications (n = 2 in gender classification and N in age classification). The model calculates the score vector of each input training picture shown below.

The obtained score vector and data correspond to the label c_t ∈{1,2,…,N} to calculate SoftMax loss.
3.1.1 Gender Classification
Gender classification task is binary classification. The main difficulty is that some face images themselves are difficult to make clear gender judgment, such as the face images of low age group. For gender classification, most researchers use VGG networks. Apart from VGG16 and VGG19, other network structure direction, such as simple 20-layer convolution, Resnet18, Resnet 34 and Resnet50 use the independent convolution network to classify the gender, which makes the model has a higher classification accuracy and reduces the resource occupancy rate, so as to improve the flexibility of the model.
Gender classification model can be regarded as composed of two parts: convolution network part and fully connected network part. The input of convolution network is the original image, and the feature is extracted by convolution layer. Each convolution layer is connected with a maximum pooling layer and a RELU layer. The output of convolution network part can be regarded as the feature extracted from the original image. The further the convolution layer is, the higher the extracted feature will be. The input eigenvector a of the fully connected network part is obtained by formula (1), where m is the m × n-dimensional eigenmatrix of the last convolution output. At the end of the whole connection part is a SoftMax operation, which outputs the final gender classification results. The parameters of the model include the weight and bias of convolution kernel and fully connected neurons. These parameters are adjusted and optimized by Adam algorithm at the same time, and the amount of calculation is very small.

3.1.2 Age Prediction
Age prediction task and gender classification task are similar in many places. However, if we want to extract the subtle differences of images of different ages in the age prediction task and eliminate the influence of noise such as clothing accessories on the results, it is bound to require more complex network structure. A typical age classification network is obtained by training and improving the 16 layer 3 × 3 convolution structure of VGG. In order to improve the accuracy, data pre-processing method such as face alignment by MTCNN and increasing the use of association relationship between age groups can be applied.
3.2 Network Description
We employed two different well-known deep CNN models, which are VGG including VGG-16 and VGG-19, and ResNet including ResNet18, Resnet 34 and Resnet50. For instance, in VGG- 16, there are 13 convolutional layers and 3 fully connected layers. To prevent overfitting, dropout method was employed. SoftMax loss was used in order to produce probabilities for the classification task. In addition, in this work we utilized combination of cross-entropy loss, and order loss. We also used weight decay as a regularizer in the training phase in order to prevent overfitting. Weight decay parameter is set to 0.001 in the experiments. The other deep CNN model that is used in this work is ResNet. In contrast to the VGG, there are no fully connected layers except the output layer in the ResNet. There exists a global pooling layer between the convolutional part and the output layer. The input size of both of these networks is 224 × 224.
3.2.1 VGG network structure
The convolution part of the age classification model constructed in this paper reuses the first 16 or 19-layer convolution of vgg-16 or vgg-19 network structure. The 16-layer or 19-layer convolution network can be regarded as five levels of convolution through the division of pooling layer. Through these five convolutions, the input face image can simulate the visual processing process of human eyes and brain, and can obtain better distinguishing features, thus completing the task of age classification or prediction. The final full connectivity layer of the age classification model simulates the logical cognitive process of the brain and classifies the extracted features. Because of the numerous parameters of the model, it is very difficult to use gradient descent training directly, so this paper adopts the method of pre training to speed up the training and improve the accuracy. The specific process is discussed in Experiment section.

Figure 2 illustrates the convolution part of VGG16 model, as an example. In VGG- 16, there are 13 convolutional layers and 3 fully connected layers. To prevent overfitting, dropout method was employed. All convolution operations use 3 × 3 convolution kernels with a fixed step size of 1,2 × 2 and a fixed step size of 2. Since all the convolution operation cores of these five layers are 3 × 3, and the number of convolution kernels in each layer is the same, the convolution with the core size of 5 × 5 is equivalent to the convolution of Volume 1 to Volume 2, and the volume 3 to Volume 5 is equivalent to convolution with the core size of 7 × 7. Compared with using 5 × 5 or 7 × 7 convolution kernel directly, the convolution network can save a lot of computation and memory, and at the same time, after many times of RELU learning, the classification effect of the final model is more differentiated, so as to achieve better classification effect. It can be calculated that although the number of layers of the network is very large, the final total number of parameters is not large.
3.2.2 ResNet network structure

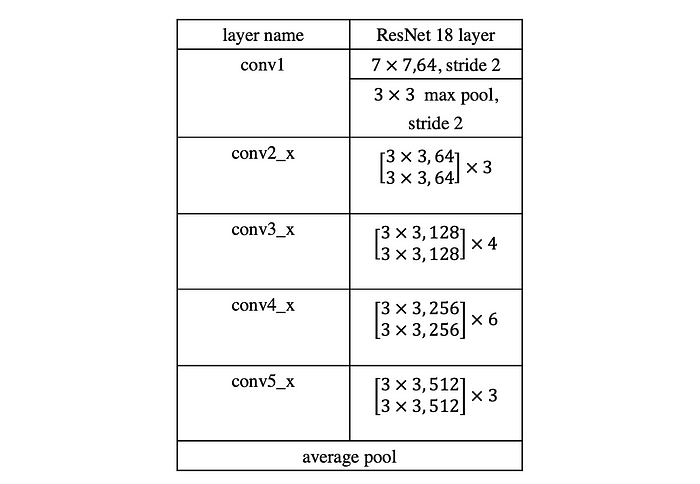
The backbone of the former network is ResNet which has been verified its superior ability to extract features in many application scenarios, such as classification, detection, semantic segmentation, etc. The main backbone of different ResNets, such as Res18,Res34,Res50 are similar, as shown in Figure 1. Each ResNet network consists of three main parts: input part, output part and intermediate convolution part. The intermediate convolution part includes four stages from stage 1 to stage 4. Although the variants of RESNET are rich, they all follow the above structural characteristics. The difference between networks is mainly due to the differences in block parameters and the number of convolution parts.
The parameters of the network’s convolution layer are shared. Taking Resnet18 as an example, the middle convolution part is from conv2_x to conv5_x in Table 1. The [2, 2, 2, 2] represent the repeated stacking times of block.
3.3 Improvement in Loss Function
3.3.1 Label Smoothing
Label smoothing is a frequently used trick in image classification. By weighted sum of labels, better results can be achieved than one hot label. Label smoothing transforms the label from y_k to y_k^LS. The transformation formular is shown in Equation (3).

As can be seen from the original form of “smooth” label. Take cross entropy as an example. The original form of cross entropy is shown in Equation (4).
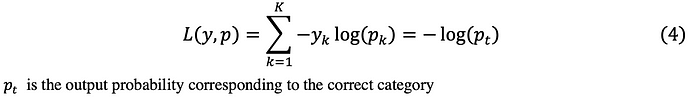
Cross entropy under label smoothing is shown in Equation (5). It can be seen that even the pi of the incorrect class appears in the loss function, and the correct class and the incorrect class have different weights. Training a network with label smoothing encourages the differences between the logit of the correct class and the logits of the incorrect classes to be a constant dependent on α.

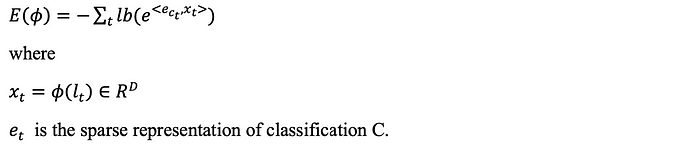
3.3.2 Order Loss
The order loss is utilized to obtain more discriminative features. The main motivation behind order loss is to punish the prediction which is far from the target. The distance between prediction label and target label is measured and the total order loss is calculated. Then, order loss part and cross entropy loss or label smoothing loss are summed to calculate the final loss. The centre loss tries to produce closer features for each class centre, but it is not responsible of providing separable features. Thus, this is complemented by cross-entropy loss. Besides, for the total loss value, there is a coefficient for centre loss that determines the effect over total loss. The formula of the total loss is presented in Equation 6. The first part of the formula is the cross-entropy loss, and the second part is the order loss. In the order loss formula, c_yi represents yiᵗʰ class target and yiᵗʰ prediction. In the experiments, λ coefficient is selected as 0.1 according to the results obtained on the validation set.

3.3.3 Combined Loss

According to Equation (7), the calculation of total age and gender losses are based on summation of the soft- max loss and multiplication of the order loss with λ coefficient as explained before. After the measurements of the total age and gender losses, we have combined these loss values using β coefficient. The main motivation behind introducing the β coefficient is that since gender classification result is significantly high, we have tried to highlight age classification loss for the final loss. With this coefficient, we can basically change the effect of age-specific and gender-specific losses over total loss. In the experiments, we have tried several different β coefficient and according to the obtained results on the validation set, we have achieved the best performance with β = 0.66 value.
4 Experimental Results
4.1 Datasets
In our experiment part, we use the Adience dataset downloaded from Kaggle (https://www.kaggle.com/ttungl/adience-benchmark-gender-and-age-classification). There are total 19k images in this dataset and were split into 5 different folds. Since some of images labels are none or unknow and some of age labels are a specific value instead of interval we wanted, these incomplete data are filtered out and the dataset remains 16k images in data pre-processing.
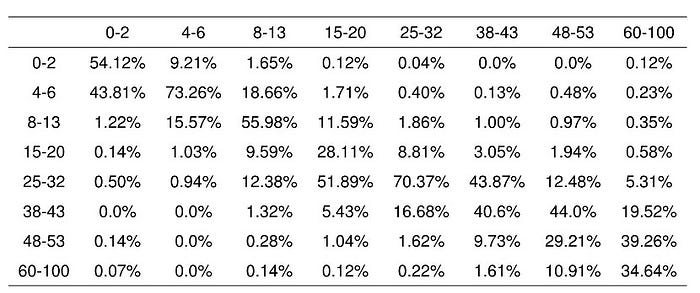
Now every instance in the dataset have both age and gender label. For gender, it consists 2 different classes (f, m), and for age it consists 8 different classes (0–2. 4–6, 8–13, 15–20, 25–32, 38–43, 48–53, 60–100). Table 2 is the distribution of their ground truth.

4.2 Implementation Details
We have tried different models (base-CNN, VGG, ResNet) and different hyperparameters (pretrained, learning rate changing strategy, optimizer, loss weight between age and gender, data augmentation, dropout rate, MTCNN pre-processed data, order loss and smooth cross entropy loss) on our experiments. We fixed the starting learning rate for every experiment because we think the important part is the learning strategy instead of initial learning rate.
4.2.1 Models
In the first step of our experiments, we aim at selecting backbone models. We have tried base-CNN, VGG16, VGG19, resnet18, resnet34, resnet50 with and without pretrained, and we fixed other hyperparameters. The accuracy result of different models is in Table 3. Next, we choose the model with highest accuracy score, resnet18 to do the further hyperparameters experiments.

4.2.2 Learning Strategy
First, we implement three learning rate change strategy: step, ReduceLROnPlateau and CosineAnnealing.


The step strategy is reducing learning rate 4times for every 5 epochs, and ReduceLROnPlateau is reducing learning rate when the validation accuracy stops increasing. CosineAnnealing strategy is a period learning strategy, which makes the model possible to jump out the local minimal and search for new minimal which is closer to global minimal.
After experiments, we found CosineAnnealing learning strategy could do a little bit better than step in gender (89.62% vs. 89.69%) but performs worse in age (54.01% vs. 54.57%). So, we choose the step learning strategy as our final learning strategy.
With regards to optimizer, we tried SGD but found it does not perform better than Adam, so we fix our optimizer to be Adam in the following experiments.
4.2.3 Weight of Loss
As previously mentioned, we have totally three loss: CrossEntropy loss of age, CrossEntropy loss of gender, order loss of age. We fix the weight of CE loss of age to be 1 and do experiments to find the weights of other loss. A normal method is using gridCV to change the weights of gender CE loss and order age loss and the same time to find the best, but it requires a lot of GPU to running the experiments, so we take a step back and use cross validation on each of them respectively, which makes computation more efficient. In the first step, we freeze the weight of order loss to choose the best gender loss weight, and in the second step, we search for the best order loss weight. The final weights for gender loss and age order loss are 0.5 and 0.01 respectively and the age accuracy and gender accuracy are 54.99% and 89.55% respectively under this configration.
4.2.4 Data Augmentation
Data augmentation is a very important part in CV task. The one reason is that some task does not have enough dataset for model training, thus data augmentations such as flipping, cropping are very useful for it. Another reason is if the target task data have a small gap between our training data, data augmentation can help model to be more generalized thus could perform better than the raw data training on the target task.
Although data augmentation is very useful, choosing an improper data augmentation will confuse the model. In this age and gender prediction task, our data was downloaded from a kaggle competition. Actually, human faces in these data have been roughly aligned to their head position and slope angle, but still there are lots of pictures which lights are not good enough when shooting and many pictures have more than one faces. So, we tried ColorJitter (only change brightness and contrast), RandomPerspective data augmentation methods when training model. The result is this could increase age accuracy to 89.86%, while decrease gender accuracy to 53.33%.
4.2.5 Dropout and Regularization
During our experimentation, we find that age and gender accuracy are always very high on training, but very low on validation and test. This situation might be caused by overfitting, and in order to alleviate it we have tried L2 regularization on model weights and different dropout rate. And finally, we found L2 regularization will not increase the accuracy on 5fold CV score and the best dropout rate is 0.3.
4.2.6 Experiments in Proposed Improvement Methods
Apart from the above experiments, we also tried two extra methods to improve our result. The first one is using MTCNN to predict the face boxes of all original human face images, and crop the boxes as a new dataset, then the train and test are all done on the new dataset. If MTCNN could not detect any face in an original image then we just copy this image to the new dataset, and if MTCNN detects more than one faces in an original image then we choose the box with the highest confidence. But the experiment result of this method decreases both gender accuracy and age accuracy to 85.44% and 49.61%, respectively so we think it is better to remain our original data augmentation.
The second method is replacing Cross Entropy loss with smoothCrossEntropy loss (Label smoothing loss). This will increase the gender accuracy a little.
4.3 Results
The best hyperparameters are in Table 4, and the final accuracy on gender and age are 89.56% and 55.00% respectively.

This is the prediction percentage table on gender and age by our best model Table 5 and Table 6. Every column is a specify ground truth label and sum up to 100%, and every row is a predicted value.

5 Conclusion
To sum up, we have used 6 models as our backbone network structure and the result shows that resnet-18 has better accuracy on this task. Also, we found that some data augmentation methods are not good at this task including MTCNN pre-processing, and the reason might be the box that MTCNN captured sometimes does not include human’s hair, that might make the model harder to distinguish gender and age. Finally, our proposed method label smoothing loss and order loss could slightly improve the model performance on 5foldCV accuracy.
References
[1] Benchmark for Age and Gender Classification: https://paperswithcode.com/task/age-and-gender-classification