Real-Time Volume Detection in Cabinet Based on Ultrasonic Sensor Array
The project of my bachelor thesis achieved during the internship in Robert Bosch
Abstract
With the continuing high demand for road transport of goods, accidents can occur during transportation from one place to another, often resulting in the loss of goods. Therefore, it is necessary to monitor the state of goods in real-time, before and after transportation. A real-time volume detection system can be designed and implemented to detect the volume of goods inside a cabinet during transportation, using several remote agents. Each agent is an embedded device with integrated sensors, Arduino microcontroller and GSM enable modules. Combined with the Internet of Things (IoT), the microcontroller can be interconnected with a cloud server to collect and send sensor data via Global System for Mobile Communications (GSM). The system can provide a solution for monitoring the status of goods and is further helpful to achieving scientific management.
1 Measurement Technique
The theoretical model of carriage is shown in Figure 1. The ultrasonic sensor (USS) array is located underneath the top of the cabinet of the truck. The measurement theory is to measure the height of boxes via the ultrasonic sensor array; from this, the volume can be obtained by the sum of the product of the designed single sensor area (resolution) and the height of boxes. The height of boxes can be determined by using the height of the cabinet of the truck to subtract the measured distance from the sensors to the boxes.

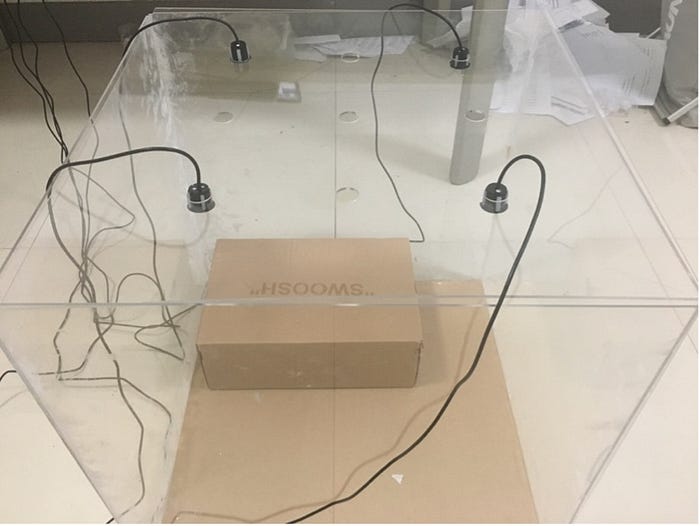
However, given cost considerations, there is no need to implement a 60-sensor model since 4 sensors can effectively demonstrate the design theory and implementation methodology, with it being possible to upscale the same working principle to 60 sensors. Due to the limitations of the actual experimental site, the standard cabinet on a truck is simulated by using an Acrylic box with the dimensions 50cm×50cm×50cm (top view is shown in Figure 2). If a sensor detects an object under it, the volume value can be calculated by 25cm×25cm×height of the box. The total volume is the sum of the detected volume under each sensor.

2 System Architecture

The logical view of the system is shown in Figure 3. The performance of the system can be divided into three parts: backend connected devices, communication, and front-end.
2.1 Back-end Connected Devices
The back-end connected devices include the microcontroller with GSM connectivity and the sensor. The sensor measures the data and the microcontroller reads it. The data is sent from the microcontroller to the gateway via GSM.
2.2 Communication
The communication part is how the back-end communicates with the front-end. The data sent from the microcontroller is received by the gateway that forwards the data to HTTP. When the HTTP integrates with a dashboard, the data is sent to it and then visualized.
2.3 Front-end
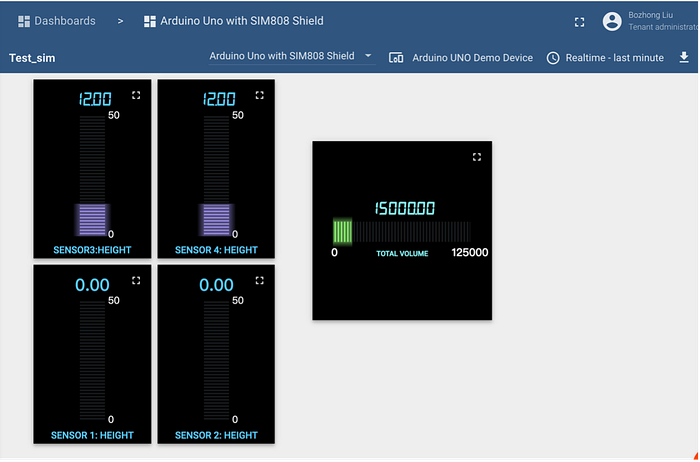
The front-end part presents how the data sent from the back-end devices is visualized on a dashboard. The dashboard presents the data as a value or a chart.
3 Sensor Tradeoff
3 .1 Ultrasonic Sensor
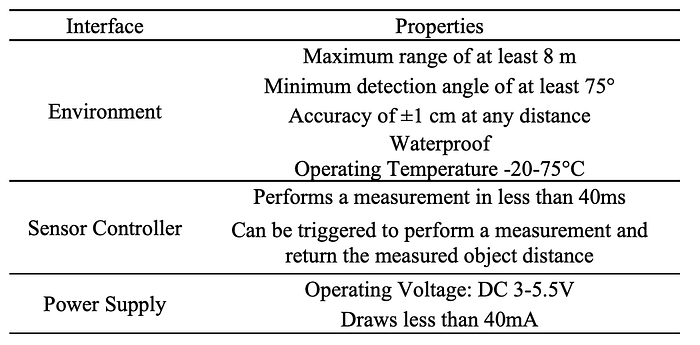
Ultrasonic sensors are an effective, low cost, and low power method of sensing objects in a user’s environment. Although a lower frequency sensor should be selected for detection at longer ranges, a moderately high frequency of around 40kHz is a good option for this project since it is cheaper and therefore cost-effective when using many sensors.The choosen sensor used in the module passes our measurement requirements with a range of 20cm to 8m, a detection angle of 75°, and an accuracy of 1cm. The board that controls the driver can perform a measurement in less than 50 μs and only draws about 40mA during a measurement. The properties of this sensor block interfaces are listed in Table 1.
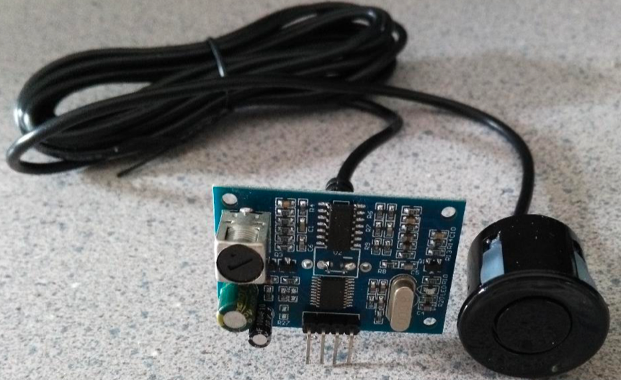
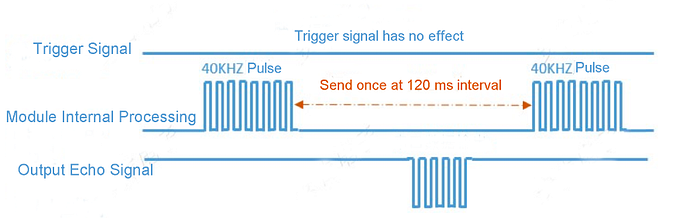
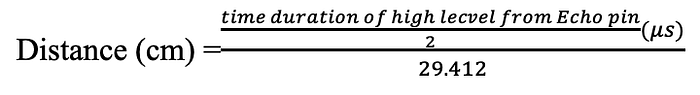
The ultrasonic circuit board has four pins: VCC, Trig, Echo and GND. The working principle is shown in Figure 5. When the Trig pin is given a high-level trigger signal greater than 10μs, the Echo pin will then output a time duration at a high level. The speed of sound in the air is approximately 340 m/s, which corresponds to about 29.412µs/cm. Therefore, the distance between the sensor and object can be calculated by the following equation.
The sensor is read with C++ code. The measurements are accurate enough for the purposes of the thesis work. While the sensor reading may vary drastically on some occasions, the average value of those readings can be considered accurate.
3.2 Infrared Laser Sensor
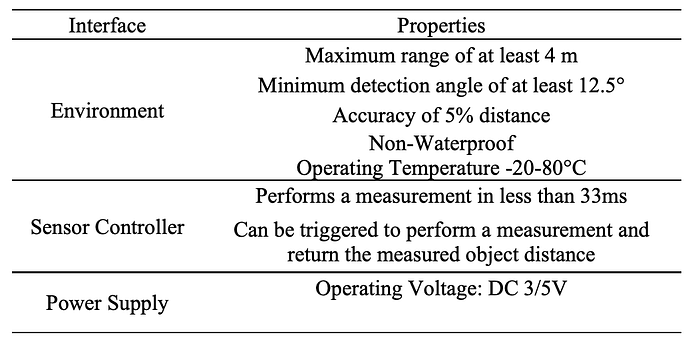
Although infrared laser measurement sensors are not a new technology, it has only become possible to achieve small, low-power, cost-effective components in the past few years. As such, there are few laser sensors on the market that fit all our design requirements. The infrared laser sensor has been chosen to be undertaken more accurate sensor measure measurement. It is tiny, at only 4.4×2.4×1 mm. The sensor fits the measurement requirements, with a maximum range of up to 4 m, a measurement angle of 12.5°, and an accuracy of 5%. Its measurement time can go as low as 20 ms although a standard measurement time of 33 ms is applied in this project since accuracy would be reduced if the measurement time is reduced. The sensor consumes little power, drawing the only 19mA during a measurement. These characteristics make it suitable for this project. The properties of this sensor block interfaces are listed in Table 2.
3.3 Comparison of Two Sensors
The chosen infrared laser sensor communicates over an I²C bus. Therefore, there are capacitance limitations through the I²C communication protocol as too much capacitance can lead to communication errors and signals being sent by the microcontroller being distorted. Theoretically, each additional sensor on the bus adds 10pF of capacitance and up to 40 sensors could be added since the maximum capacitance allowed on an I²C bus is 400pF. There may be capacitance problems if more than 40 sensors are required to be used in a ‘real world’ situation in a truck.
While the laser sensors do provide a more accurate result, the ultrasonic sensor is used to compensate for the shorter range and smaller detection angle of the laser sensors by providing a wide-angle, long-distance measurement. This ensures that objects that are most likely to collide with are not missed. In addition to this advantage, its range is adequate, the shape is small and easy to be mounted, the price is low, and it can be used outdoors without performance being affected.
4 Result
5 Conclusion and Future Work
5.1 Conclusion
The IoT-based real-time detection for the volume of square boxes inside the cabinet was successfully implemented.
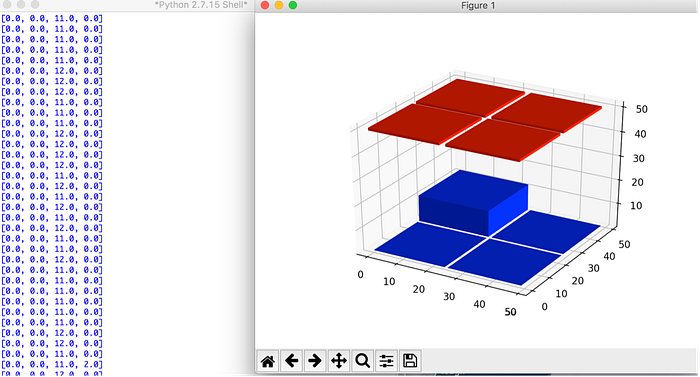
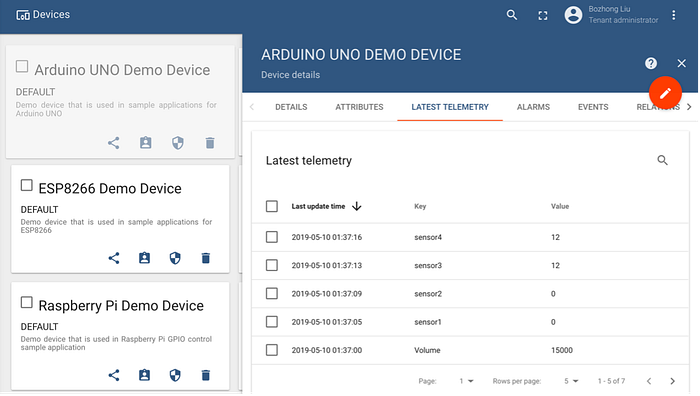
Both the ultrasonic sensor array and infrared laser sensor were implemented and compared. It has been found that the ultrasonic sensor can provide a wide-angle, long-distance measurement and compensate for the shorter range and smaller detection angle of the infrared laser sensors. Since the system does not require very high accuracy or resolution, the ultrasonic sensor-based embedded system is a better option. The designed embedded system can read and collect the sensor data and send it accurately to the IoT platform, Thingsboard, via GSM. The generated real-time data can be stored locally on the SD card and in the clouds of the IoT platform. The visualized live graph can be displayed locally by Python and by Dashboard on the IoT platform.
It should also be possible to collect location data via a GPS module and for this to be visualized on Google map in real-time. The data can also communicate with the mobile. When the user sends a message to the number of the SIM card on the device, the user can receive a message with the sensor data and location at that moment.
The measurement technique can be optimized by using a dynamic measurement technique discussed in section 4.2.
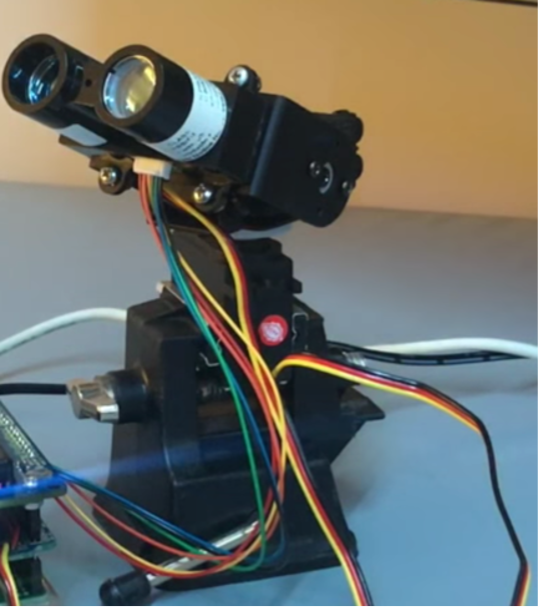
5.2 Further Work: A Dynamic Measurement Technique
In addition to the stable measurement technique mentioned in my orginal bachelor thesis section 3.1, another solution, a dynamic measurement technique, can be used to build a 3D point clouds map of the environment and reconstruct the object volume from point clouds.
The hardware of the dynamic measurement technique can be constructed by a distance measurement sensor and two servos, as shown in Figure 9. Therefore, point clouds can be drawn by the two rotatable servos, which can provide two degrees of freedom. The lower servo can control the sensor to rotate left and right and the upper servo can control the sensor to rotate up and down. After the sensor rotates 360 degrees on a horizontal plane, it can then rise up one degree vertically and rotates another 360 degrees. The sensor rotates and measures the distance at the same time. Figure 10 shows the result of visualized point clouds that are measured from the device and processed in MATLAB. By using the Space Carving method that takes a sequence of images for an object through 360 degrees, the 3D model of the object can be constructed (as shown in Figure 11) and therefore the volume of the object can be calculated.